--:--
85%
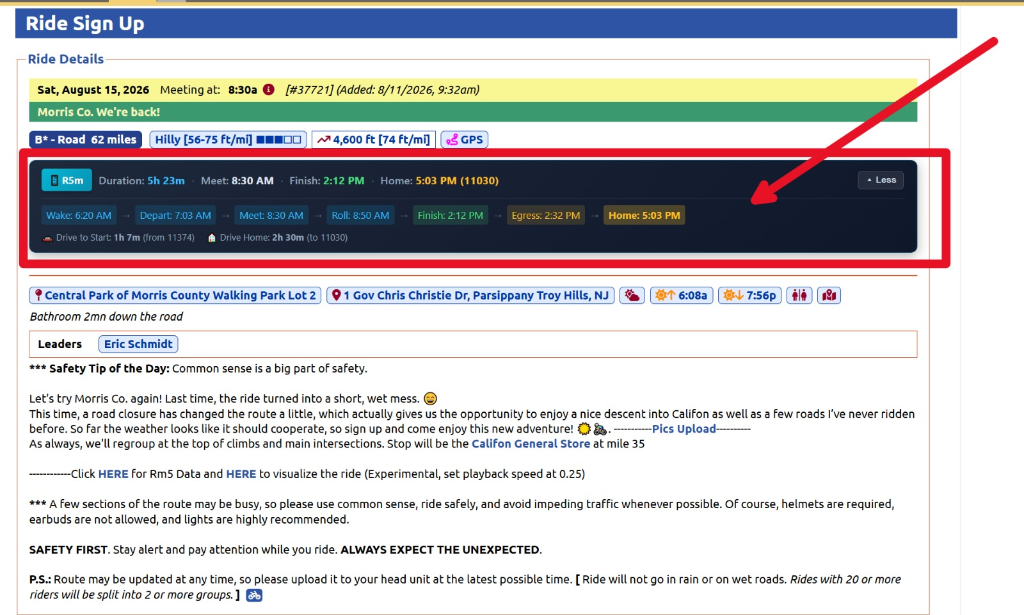
Meet
--
Rollout --
mi Left --
ft Left --
Finish --
Home --
Wake: -- Finish: -- Depart: -- Egress: -- Meet: -- Home: -- Roll: -- GMAPS
🀠 --
--
--
--
0
--
--
--
--
CLIMBS
No active route loaded
🚴 Ride Selector
πŸ”οΈŽ
πŸ‘₯ Group Lobby
β€” OR JOIN EXISTING β€”
βš™οΈ Settings
Comma-separated partial names to highlight on ride rosters (e.g. "dav, rob, smith").
πŸ› οΈ ADMIN TOOLS
🚦 Traffic Breakdown Show Google/OSRM leg details in timeline popup
Favorite Rides
No pinned favorites
Share Ride Info
R5m
Link Portal
R5m Help

⛰️ Climb Challenge Ratings

R5m evaluates route elevation profiles using two distinct rating methodologies: FIETS Mode and A2 Mode.
πŸ”— FIETS Reference & Climb Challenge Details
FIETS Mode (Default): Calculates physical exertion (suffer score) based on total climb gain, overall distance, and high-altitude bonuses above 1,000m (3,281 ft).
A2 Mode: Measures peak gradient severity by analyzing sustained rolling 100-meter (328 ft) segments along each ascent.
FIETS Score Equation
Score = (Gain_mΒ² / (Dist_m Γ— 10)) + max(0, (PeakAlt_m - 1000) / 1000)
Difficulty Ranking Thresholds
Rating FIETS Score A2 Avg Grade
Easy < 0.25 < 3.0%
Steady 0.25 – 0.49 3.0% – 6.9%
Stiff 0.50 – 0.99 7.0% – 9.9%
Brutal 1.00 – 1.99 10.0% – 12.9%
IHEFC β‰₯ 2.00 β‰₯ 13.0%
Normalized Severity (NS) Score
Ranks each climb relative to the easiest and hardest climb on the current route (0.00 to 1.00). Badges are color-coded: Green (<0.25), Orange (0.25–0.49), Red (0.50–0.74), and Purple (β‰₯0.75).

🏁 Basic Operation

Select or import a ride route to instantly calculate distance, elevation profile, logistics schedule, weather forecast, and clothing layering recommendations:

🚴 Ride Selector Button Tap the Cyclist (🚴) icon in the top right header to open the Ride & Route Selector. This searchable catalog lets you browse club rides with terrain filters, distance, elevation profiles, and RideWithGPS links. Selecting any ride loads its route directly into R5m.
πŸ“‹β­ Favorites List Button Tap the List + Star (πŸ“‹β­) icon in the top right header to access your Favorite Rides. Star any ride inside the Ride Selector to bookmark it for 1-tap loading without searching the full catalog again.

⚑ Route Override

Toggle Override to manually set custom distance, elevation, and meet ZIP code without loading a RideWithGPS URL.

πŸ“… Logistical Timings

R5m automatically calculates all 7 logistics milestones based on your Meet Time, driving duration, rollout buffer, and ride pace:

Wake: Recommended wake-up alarm (45 minutes before Home Departure, rounded to nearest 5 mins).
Depart: Estimated home departure time (Meet - Drive Time).
Meet: Planned arrival / staging time at the ride start location.
Roll: Wheels-rolling rollout time (Meet + Rollout Buffer, default 20 mins).
Finish: Estimated ride finish time (Roll + Total Ride Duration).
Egress: Departure time from ride site after post-ride pack-up (Finish + Rollout Buffer).
Home: Estimated arrival time back home (Egress + Return Drive Time).
πŸš— Driving Time Engine & Methodology

R5m computes your driving travel times for both legs of your journey (Home → Ride Start and Ride Finish → Return Location) using predictive real-time traffic data:

Google Maps Routes API (Primary): By default, R5m queries Google Maps Routes v2 with traffic awareness for your exact departure date and time-of-day.
P80 Conservative Risk Modeling: Google returns a duration range from \(P_{10}\) (optimistic, free-flow) to \(P_{90}\) (pessimistic, congested). R5m uses the P80 percentile (80th percentile) to ensure you arrive comfortably on-time for morning rollout without over-inflating your wake-up alarm.
OSRM Routing Fallback: If Google Maps is unreachable, offline, or quota-constrained, R5m seamlessly degrades to OpenStreetMap (OSRM) with localized historical time-of-day multipliers so timeline calculations are never interrupted.
Timeline Engine Badges: In the Meet/Timeline detail popup, the badge in the lower-right indicates the active calculation source:
GMAPS Powered by Google Maps predictive traffic.
FALLBACK Google service unavailable; active on OSRM.
OSRM Baseline OpenStreetMap routing.

🌀️ Weather

Temperatures reflect rollout-to-finish ranges. Rain and wind display peak conditions during ride hours.

Forecast Data Sources
Range Source Details
Past Historical Open-Meteo Archive
Days 0–7 NWS NOAA hourly radar-assimilated
Days 8–14 Forecast Open-Meteo 15-day global API
Days 15+ Climatology Synthetic historical normals

⌨️ Keyboard Shortcuts Desktop Only

Available when using a desktop browser or external hardware keyboard:

? Open Instructions Manual
Esc Close open sheet/modal

Ride Date
Saturday, 07/18/2026
Planning Presets
πŸ“– Ride Details
Clock Ride Plan
⏱️ ELAPSED
--
Finish: --
⛰️ CLIMBS
--
-- ft
πŸ’¨ WIND
--
--
TIME TEMP RAIN WIND EFFECT (mph)
🌬️ Head/Tailwind & Aero Power (mph/W)
+10 (+99)
🌬️ Wind Conditions
πŸ’¬ Group Chat
No active alerts.
0 / 64
Riders Signed Up (0)
⭐ Pin Favorite Ride
Save this ride configuration for single-click retrieval.
✏️ Rename Favorite Ride
Update the label for this favorite ride.
πŸ“Έ Photo Albums
Loading photo albums...
πŸ“· Photo Album Admin
Generate a public share link so riders can view and upload.
Album Name
R5 BTCNJ - Photo Album
1. Click Open Album to load the page.
2. Click the Share icon () at the top right of Google Photos.
3. Select "Create link" and Copy the URL.
🌀️ Weather
🌬️ Wind Effect Calculator
Tap map to inspect
Head/Tailwind & Aero Power (mph/W)
+15
Wind Speed (mph)
15
Crosswind (mph)
15
πŸ’¬ Group Chat